
Infogram, what is it for ?
Infogram is used to design maps, diagrams, charts… In short: everything you might need, to create a responsive visual support for your data!
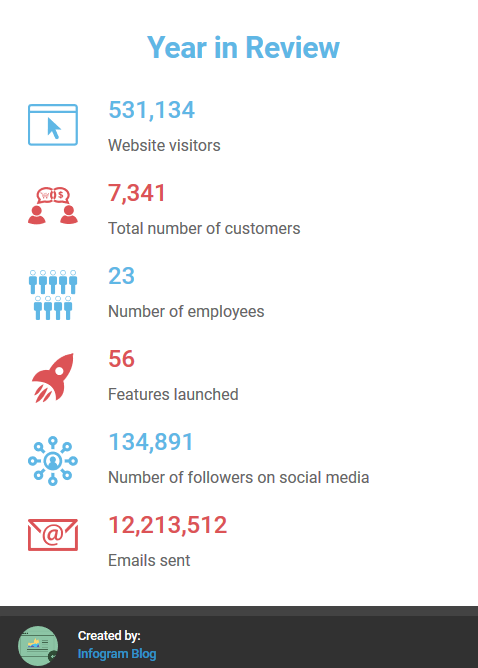
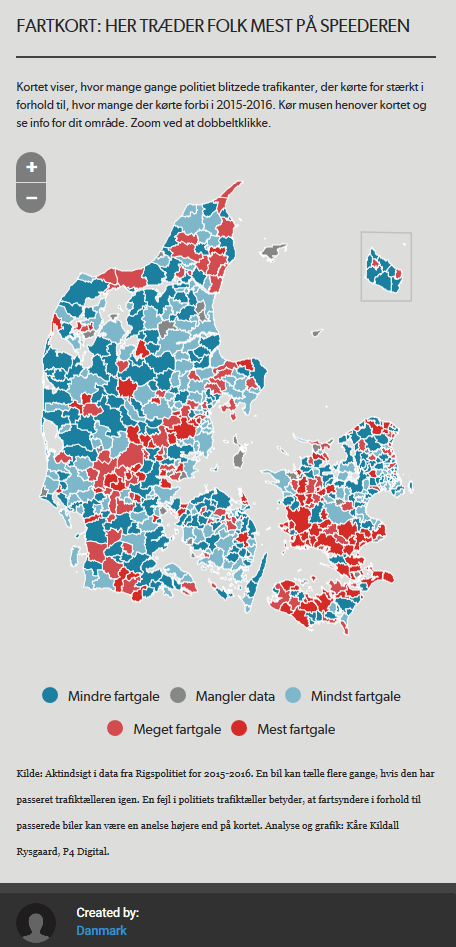
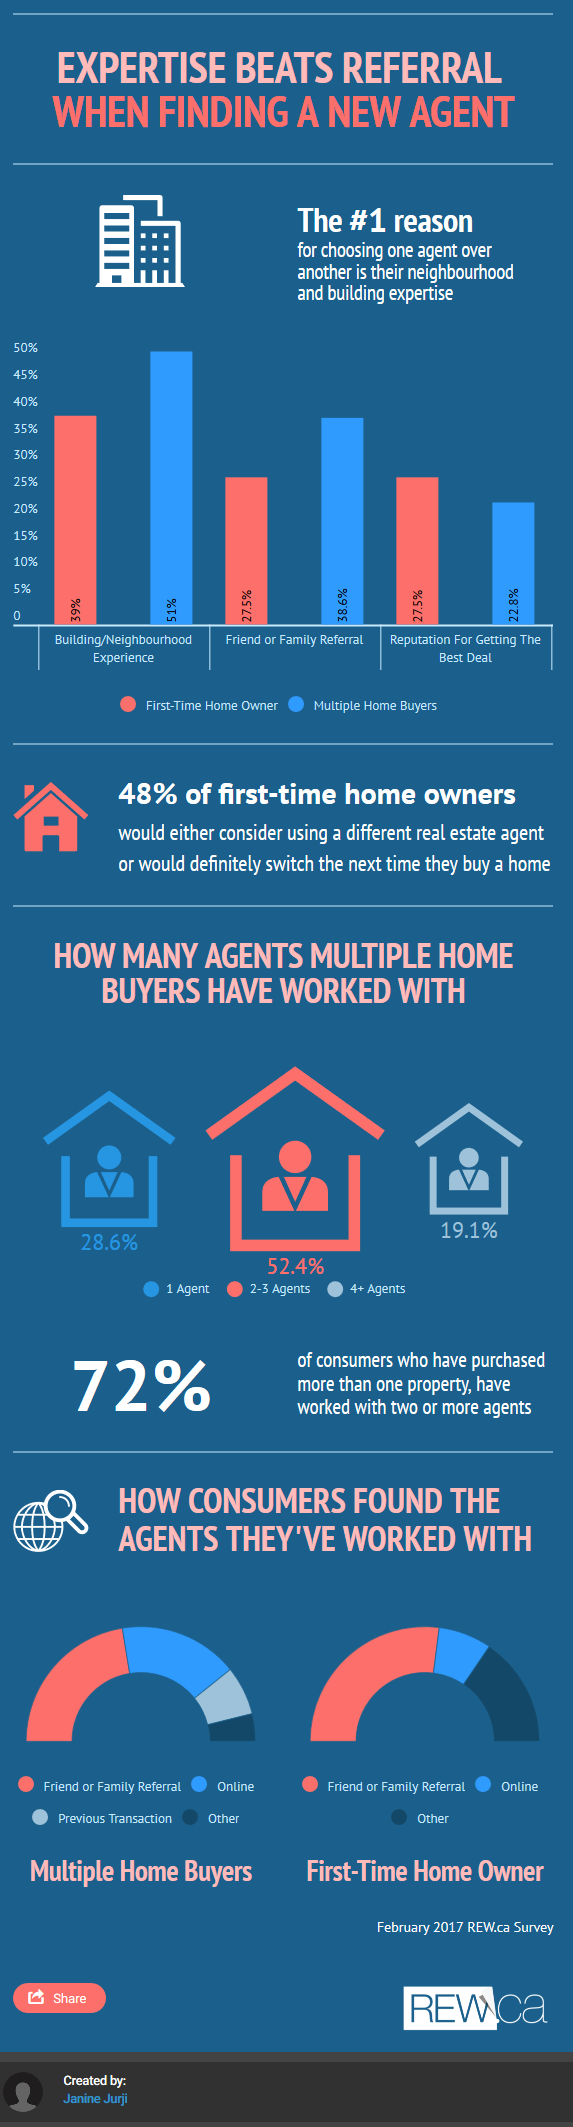
You can find here some examples of imagery made with Infogram.
What’s its specificity ?
Infogram is dedicated to data presentation, but you can be creative once arrived in content creation and customization.
Regarding data, you can import them from :
- DropBox,
- OneDrive,
- Google Drive sheets,
- Xls, xlsx, csv, JSON files,
- Your Google Analytics,
- Data sources within the website.
To take advantage of the latter, you just need to type a keyword in the search bar and all the data including it will be displayed.
It’s also possible to import data from the Infogram API, that will automatically turn them into charts.
What are its functionality ?
Infogram is very user-friendly: it has a lot of resources to help newcomers, such as a video to introduce the website, a FAQ or some tutorials. You also have the opportunity to chat with an advisor, if you want to. There is also a blog that gives more tips and examples of potential realizations.
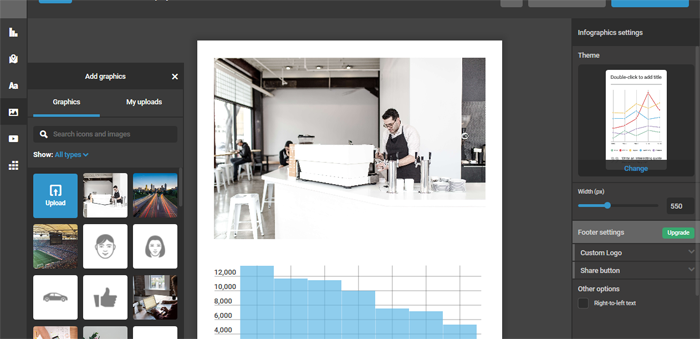
From the homepage, you can create an infographic, a chart or a map (but you can have all of them in one file) or focus on importing data to be put in future files.
As in Typeform, every field in our creation is customizable, from colors to text. Clicking on an element of our file opens duplication, deleting and adjustment options, while double-clicking enables editing data in a excel-like table.
Beware: each chart has its own features and it’s up to you to find out about them to see what best matches your needs. For instance, some charts authorise URL adding, whilst others are only countdowns. Infogram created a video to guide you through all that, you will find it on the tutorials page mentioned earlier.
Besides the elements used to visually explain your data, you can use pictures or pictures (from the website or from your computer) to keep making your file more personal and fun.
Infogram also has an Analytics feature that indicates how the users found your file, as well as the number of daily or monthly views generated by your file. These information are chart-presented and can be exported in csv format.
Once your file created, you can share it on social networks, embed it on your website or download it on your computer.
Infogram also offers a team tab to collaborate and share data as well as models and files with people you choose, while the library is there to help you organize your files and to store everything you’ve created or edited so far.
To sum up
Infogram is ideal to efficiently and playfully process your data to make them interesting in the eyes of your users.
1 free version and 3 professional ones are available. We invite you to have a look at this page to find out about them.
To conclude
We hope this article made you find out new things or helped you clarify some aspects of this tool.
Do not hesitate to give your feedback or share other web tools on our Facebook page !