
Google Analytics is an extremely practical and widely used optimization tool. For anyone with a website they want to evolve, it's an essential tool. Launched in 2005, there is a free version, and a paid version often superfluous for most of its users. Its primary purpose is to help you visualize your audiences, which in theory allows you to make better decisions for your business. With this article, you will have the basics of Google Analytics to learn how to analyze and interpret your results.
What is Google Analytics?
- Definition / Description
Google Analytics is an audience analysis tool for your website. This mainly means analyzing the behavior of visitors to your site and where they come from. - Utility
If you want to make your platform one of the best in its field, Google Analytics will allow you to highlight important data which will then be used to draw conclusions.
Among these data, you will find:
- Influx
- Strong / weak points (the most shared pages or the least read content for example)
- Behaviors of visitors
- Behavior changes when you modify something on your website
- Current / future trends
- The impact of your web marketing
- Visitors who share your content (therefore possibility of partnership)
- Installation
For this part, you can choose to do it alone by following the steps carefully, or you can ask for the services of a web agency (like 8P Design for example) who will also help you with analysis reports.
- Create your site’s Google Analytics account
Go to their website then click on registration. You will have to fill out a form and accept the general conditions. You must have a gmail account to properly manage aspects of your Google Analytics Account.
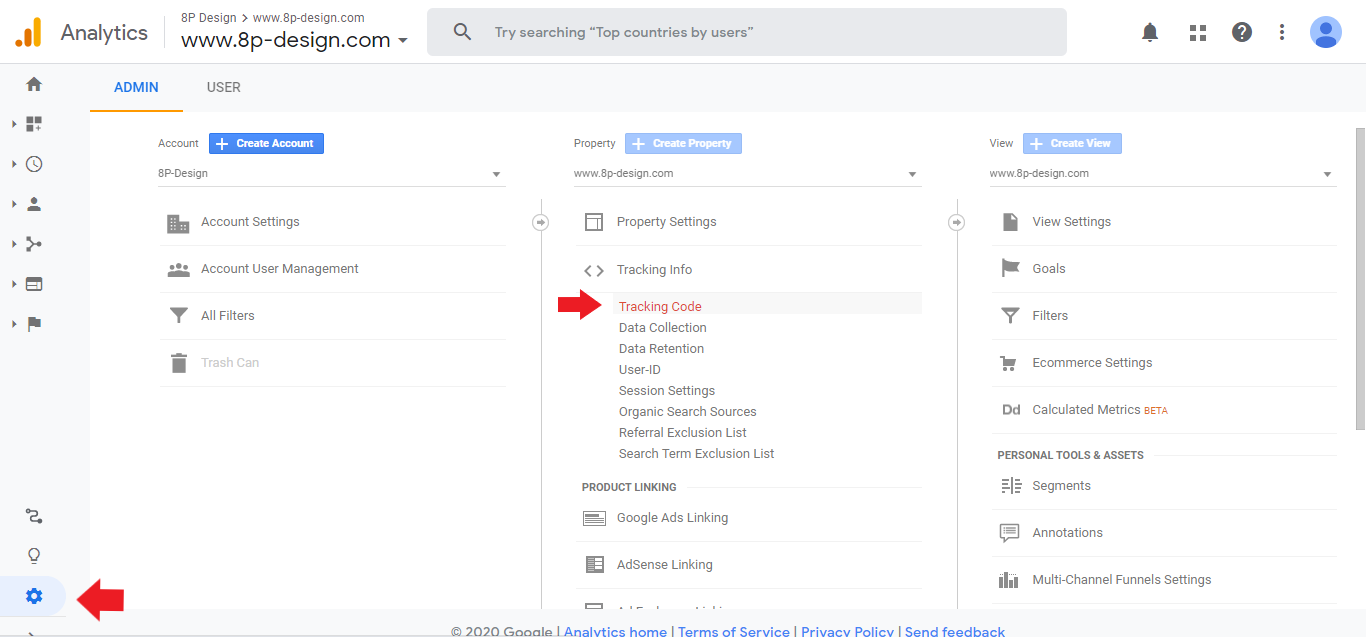
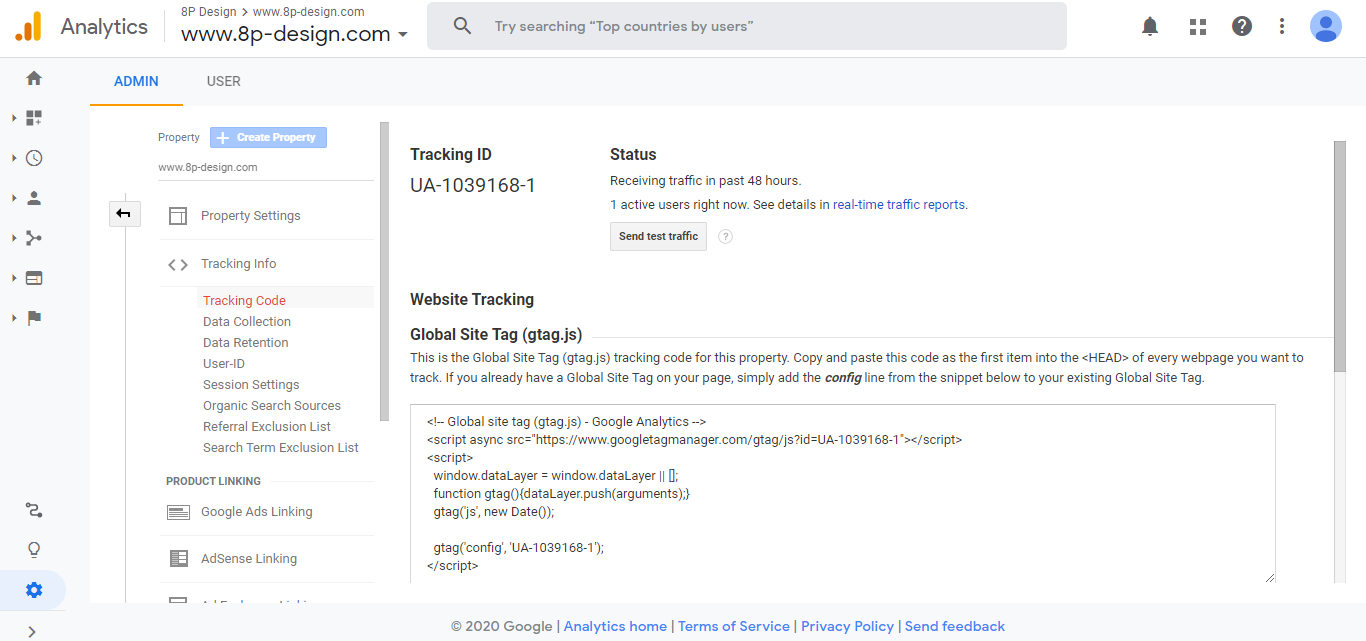
- Retrieve the Google Analytics tracking code for your site
To use this service, you will need to insert a script usable by Google Analytics on each page of your website. To do this, go to the Admin tab of your Google Analytics, click on the Settings button in the bottom left and then on Tracking information. You will find tracking codes to insert in the first position in the <HEAD> section of each page of your website if it is coded in HTML.
- Create your site’s Google Analytics account
Depending on your site management tool, there are simplified ways to display this code. Contact your Web developer.
5 things to know to get started with Google Analytics
Once the code is in place, you will only have to wait 24 hours before you can start analyzing your data. Before starting to analyze your data, it is important that you choose a period of time over which you want to see the data. You can choose the vision by hour, day, week, or month and it is necessary to modify this according to what you are looking for.
- Analyze the performance of your website
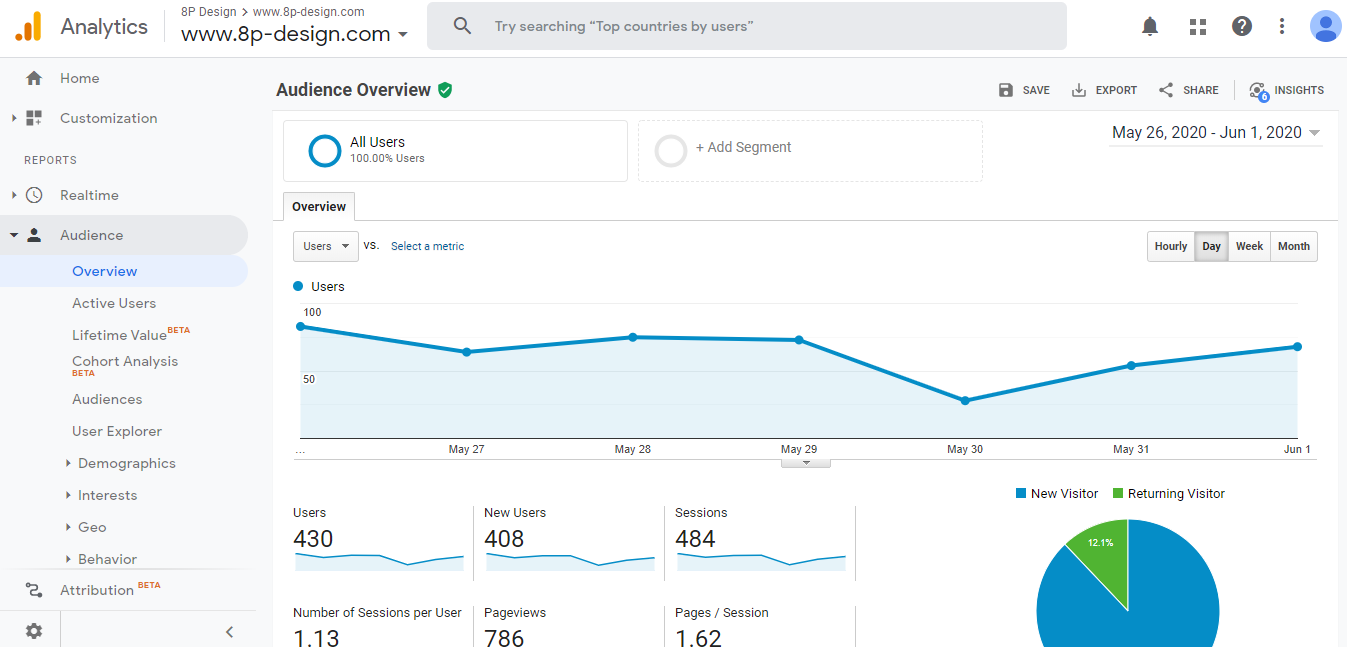
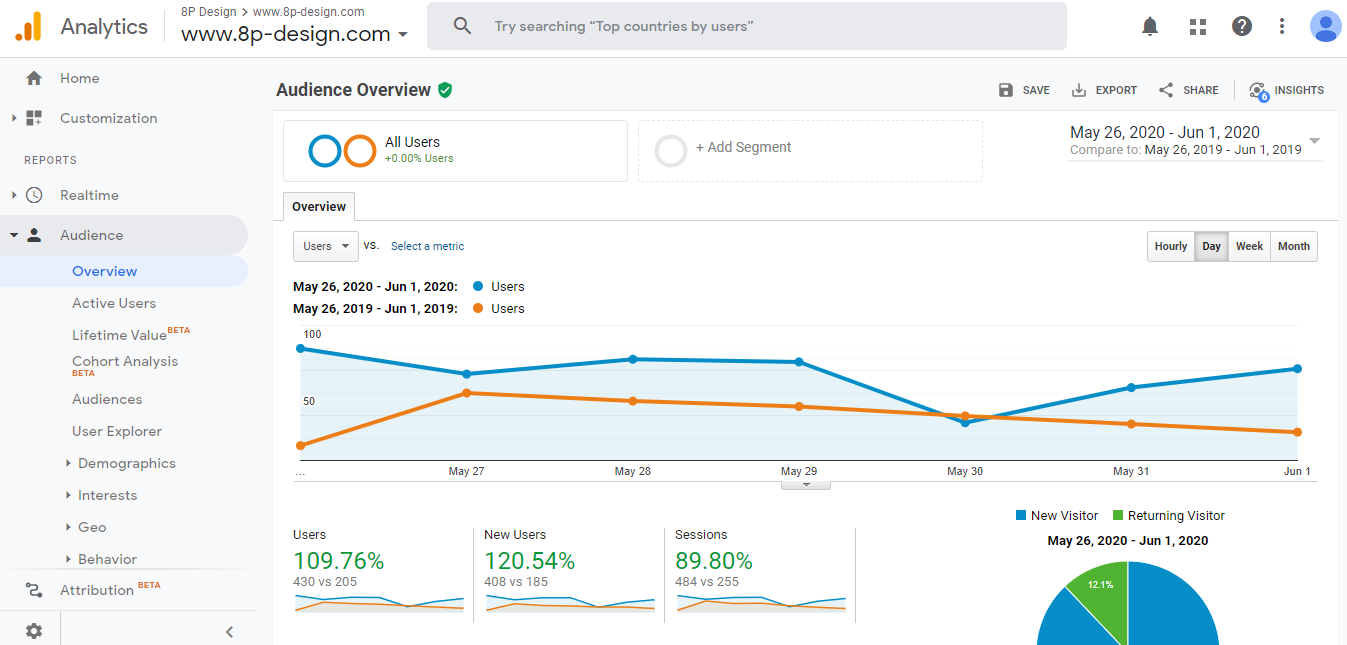
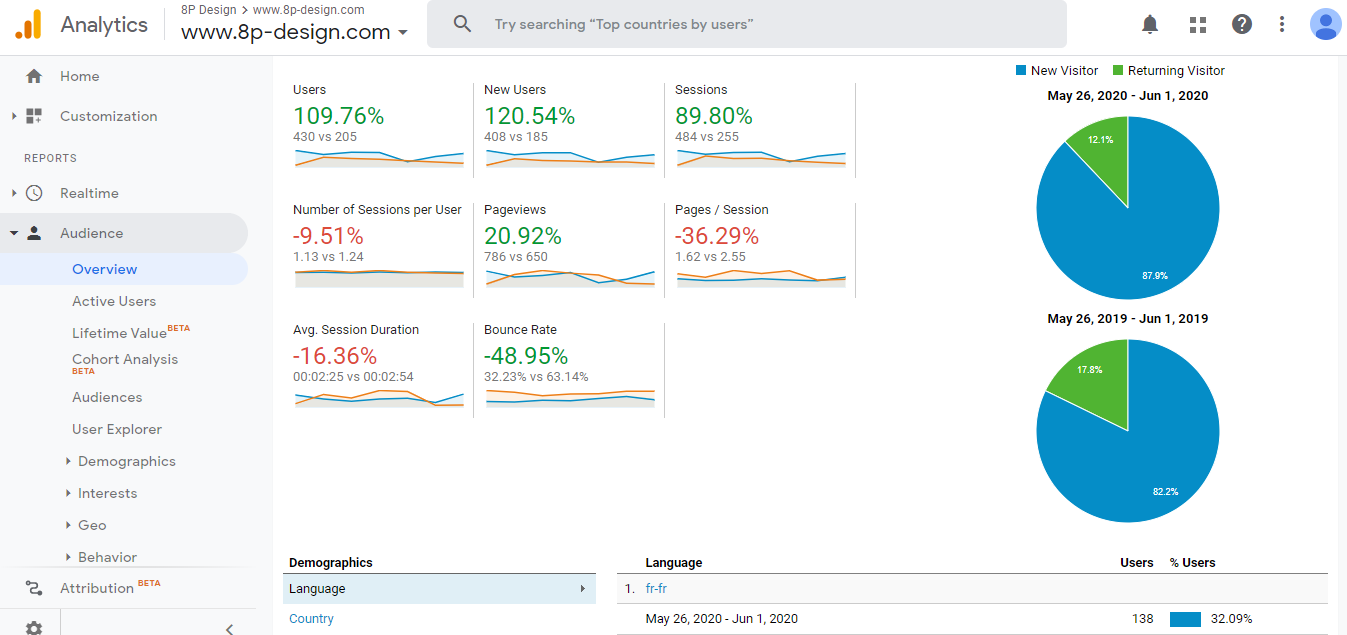
To get started with the tool, go to the home page. Among the tabs, you will find a title entitled “Audience”. This is where it all starts. When you have selected a period of time, you will land on the "Overview" tab. This graph will change depending on the period selected and the data you want to analyze. Here, we have chosen to compare the number of users for this month with the number of users for the same period last year.
Let's start with the 4 easiest variables to understand and manipulate:
- Sessions: Number of visits over the selected period
- Users: Number of distinct users who came to your site (a user can come several times, this is why there is a distinction with sessions)
- Page views: Number of page views over the chosen period.
- Bounce rate: Percentage of visitors who only visited one page of your site and then signed out. It is interesting for you that it is low, but it depends on the type of your site, and it depends on the intention of the page visited.
It’s important to analyze your site regularly. These data speak volumes, and allow you to make informed decisions. For example, if you see that your site has no visitors, it may be time to start an advertising campaign. If you are too busy and do not have the time to log in to the platform regularly, you can schedule automatic reports at regular intervals. To do this, click Share on the Overview tab and choose the frequency of your automatic reports.
- Analyze your conversion rate
In addition to the raw data, it is necessary to analyze other factors such as the conversion rate. This is data specific to your site, why it exists, what do you want to know? You have to go through these steps to filter the different information and keep only those that interest you, thereby optimizing your site.
- The conversion is expressed when a visitor performs the action desired by you. It is essential that your site has a goal. If you are aiming for profitability, and you know all the components. You sell t-shirts for example, the conversion is the purchase of a t-shirt. The conversion rate will then be the number of visitors to your site who buy a t-shirt.
- To define a goal, go to the Conversions tab, Goal then Overview. You can then define objectives. From there, click on the red button + NEW OBJECTIVE.
- Goal setting
This page appears:
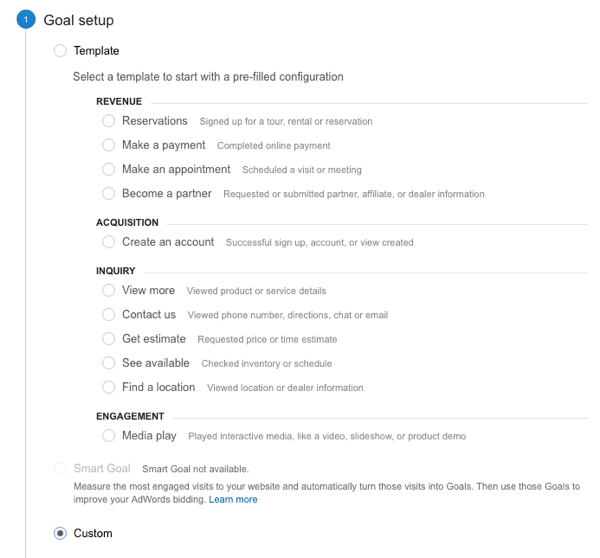
- Description of the objective
Once you have determined your objective, it remains to define it. You can choose between:
- Duration
- Destination
- Pages / screens per session
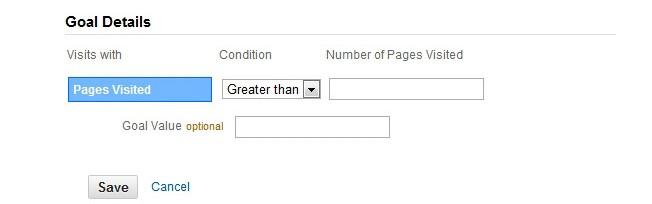
- Event
- Objective detail
Finally, the details of the objective. They are different depending on how you have determined your goal. For example, you would like visits to your site to exceed 4 minutes. First, choose a custom lens in the lens configuration. In description, specify that it is based on duration and name it as you wish. Finally, set the duration of the visit at 4 minutes and voila!
Set goals for yourself with achievable conversion rates. Try to increase traffic to your site, and when you don't reach those goals, it's up to you to take steps to fix it.
- Goal setting
- Make a segment
- The segment, as in marketing, makes it possible to group users according to common attributes. Creating segments allows you to perform more precise analyzes and sometimes understand variations in your data that are not understandable with raw data alone.
- An example of interesting segmentation is that where we differentiate between users who are converting and those who are not. By analyzing those who don't, this will allow you to correct possible weaknesses in your strategy and improve your conversion rates.
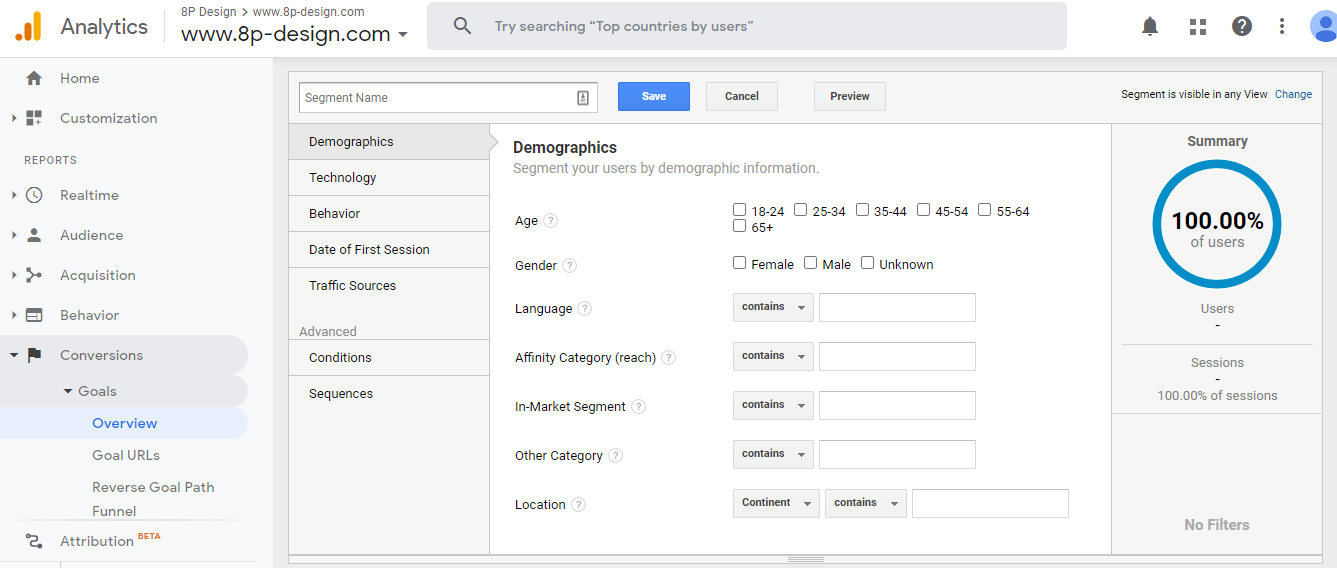
- A segment is actually a set of individual filters brought together using the segment creation tool. To create one, go to the same tab as for goal creation, but this time pressing + Add segment. Those appearing are predefined by Google Analytics, you will only have to select a segment to apply it to your reports.
If you want to create a new segment from A to Z, then press + New segment. This screen appears. Start by naming your segment, then choose the filters you want to apply, making sure they're compatible. Remember to specify the traffic sources that depend on your request. Finally, keep in mind that a segment is only interesting when you compare it to overall traffic or to another segment.
- Understanding the behavior of its visitors
Visitors' behavior is defined by the pages they visit, the time they spend on your site, the speed at which they navigate the page and the actions they take there. This is a variable that should not be overlooked when drawing conclusions on essential points. You need to have a global vision of traffic: analyze your strengths and weaknesses by looking at which pages are the most and least visited, for example, or if the contents are not read in full ...
For example, if you notice that one of your users shares a review or recommends your content, don't hesitate to contact them. The nature of the contact will be a thank you if their experience is positive or a request for information if your service has displeased them. Since there aren't many of them, make your users who share your content a priority and keep them as fast as possible. Each sharing of your site must be followed and taken into account for optimal development.
- Discover the profile of its visitors
You have the option of knowing the geographic area as well as the age range, gender or interests of your visitors. This is data that will help you adapt your offer. If you see that the majority are between 20 and 30 years old and that they are sportsmen, it is up to you to modify your communication so that this segment becomes your target if it was not already.
To access this data, go to Audience. Thanks to the Overview of the different tabs in this part, you will have all the data mentioned above. Take an example: you want to know the number, behavior and typology of visitors who visited your site in the past week. To do this, start by changing the date at the top right and apply “Last week”. In Overview of Demographic Data, you will have two graphs showing the age groups and the percentage of men and women who have visited your site for the typology. Then go to Behavior and you will then have all the information necessary for your research.
The specialists' lexicon:
- Annotation: Allows you to put comments to find your way around in your reports.
- Conversion: Performing an action that you have defined by a user.
- Dimension: What constitutes relationships. Corresponds to the allocation of your data, the City dimension indicates the city as Paris. Go read our article on how to follow visitors activity for further informations.
- Event: Measurable user interactions with your content.
- Medium: The general category of your sources. Organic research, for example.
- Objective: Carrying out an action that contributes to the success of your business.
- Segment: Grouping of users according to common characteristics.
- Session: Number of visits over the selected period.
- Source: The origin of your traffic, a search engine or a domain for example.
- Conversion rate: Percentage of users who have achieved your goal.
- Bounce rate: Percentage of users who only visited one page of your site and then signed out.
- Traffic: Visitors who already know your site and enter their address directly in their internet browser.
Conclusion
Now that you know how to analyze your performance, analyze your conversion rate, use objectives, make segments and understand the behavior of your users: you have all the cards in hand to succeed in your development in the best way possible with this great tool what is Google Analytics.
If you liked this article and want to refine your knowledge in web analysis and marketing strategy, do not hesitate to consult our other works on the subject : How to track your visitors activity, 6 étapes pour bâtir sa stratégie sur les réseaux sociaux.